Current Suspected Overdose Deaths in Delaware for 2024: Get Help Now!
Find school water testing results and additional resources
Attention Medicaid Participants: Eligibility Renewals Restarted April 1, 2023

![]()
PREVENTION TEAMS:
| - Dog Bites | - Drowning/Submersion Injuries | - Falls |
| - Fires/Burns | - Motor Vehicle Crashes | - Poisoning |
| - Traumatic Brain/Spinal Cord Injury | - Violent Injury |
Data on injured patients is submitted by all eight Delaware acute care hospitals as part of their participation in Delaware's Statewide Trauma System. This data is compiled into the Trauma System Registry. Hospital Trauma Registrars gather data from prehospital patient care reports and hospital medical records to enter into the trauma registry software program. They submit data on a quarterly basis to the Office of Emergency Medical Services' Trauma System Coordinator. Statewide Trauma System reports are then generated on various topics, including types and locations of incidents and categories of people injured throughout the state. The data can be used to identify areas of need for injury prevention programs and for research on patterns of injury in our state so that methods of addressing the injury problem can be developed and improved.
The patient population included in the Trauma System Registry is all patients with an injury diagnosis that are admitted to a Delaware acute care hospital, are transferred to or from a Delaware acute care hospital, or who die in a Delaware hospital Emergency Department. Prior to January 1, 2014 patients who fell on the same level, were over 55 years old, and whose only injury was a simple hip fracture were excluded. Patients pronounced dead at the scene of a traumatic incident are also included in the database.
It is customary to use rates per 100,000 population when reporting on different counties and/or states to allow "apples to apples" comparisons. There may or may not be 100,000 residents in the county under review, but multiplying the result by 100,000 makes that rate reliably comparable to other counties. Per 100,000 rate of population means that for every 100,000 people the state/county has the reported number of injuries. For example, 17 falls per 100,000 means that for every 100,000 people, 17 of them have fallen. Utilizing age-adjusted or age-specific rates further enhances comparability of data in instances where the age profiles of the two populations being compared are dissimilar. The age-adjustments seen below were calculated using the U.S. 2000 standard population.
Trauma System Registry data presented in the following graphs provide snapshots of various parameters and information on the patients injured and types of incidents that have occurred in Delaware.
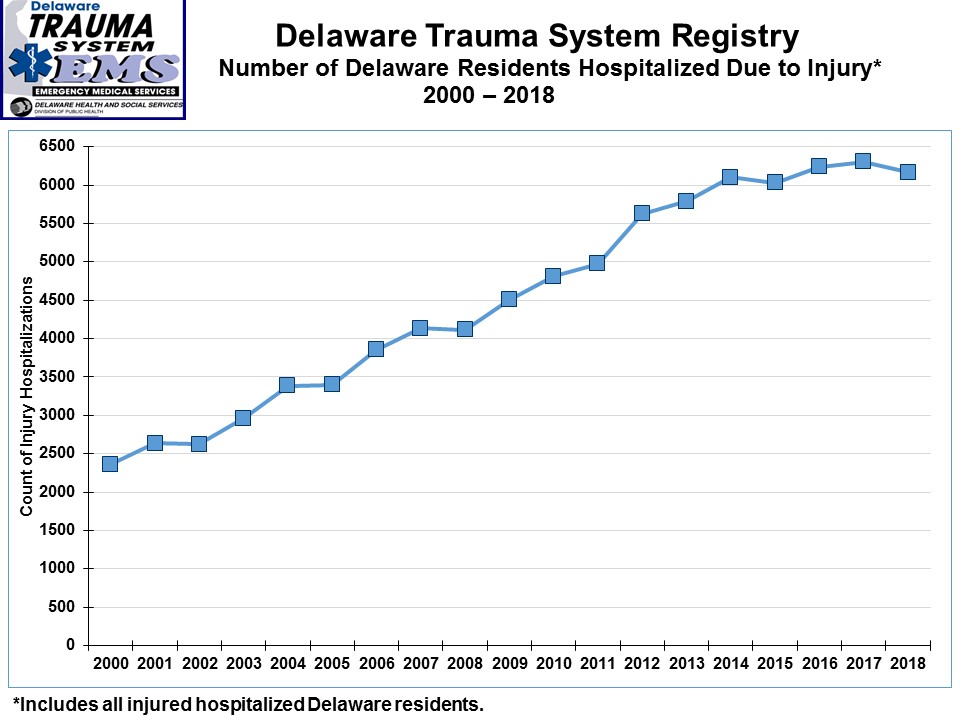
The graph below demonstrates the increasing number of Delaware residents with injuries serious enough to require hospitalization.
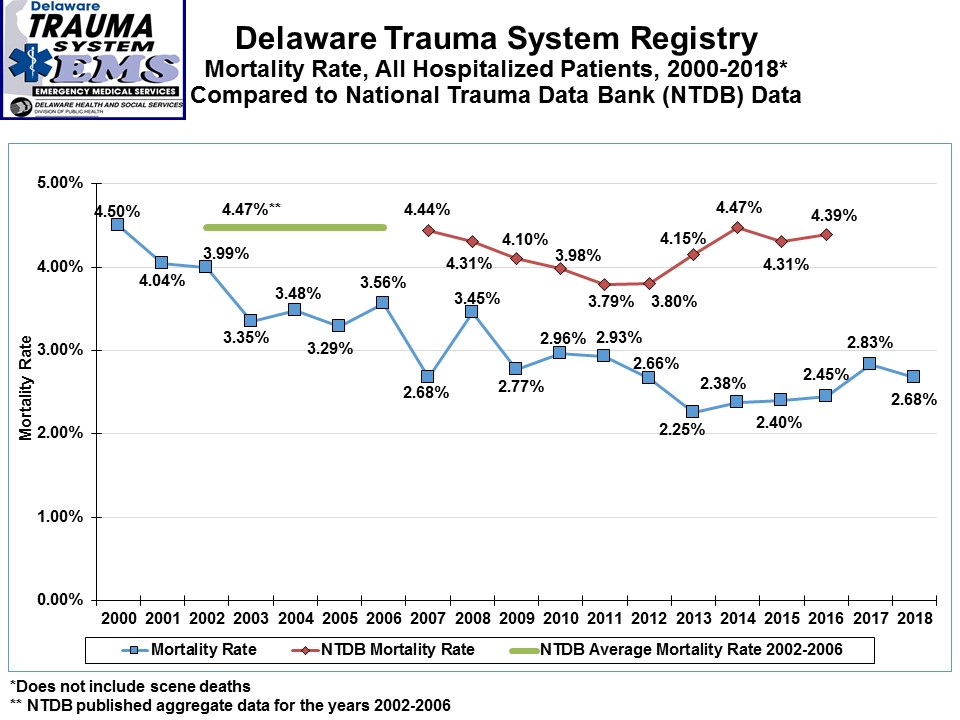
Below, the death (mortality) rate for all patients with trauma injury hospitalizations treated in Delaware Trauma Centers, is compared to national data from the National Trauma Data Bank. The mortality rate for patients treated in Delaware Trauma Centers has consistently been lower than comparable national data since the creation of the Delaware Trauma System.
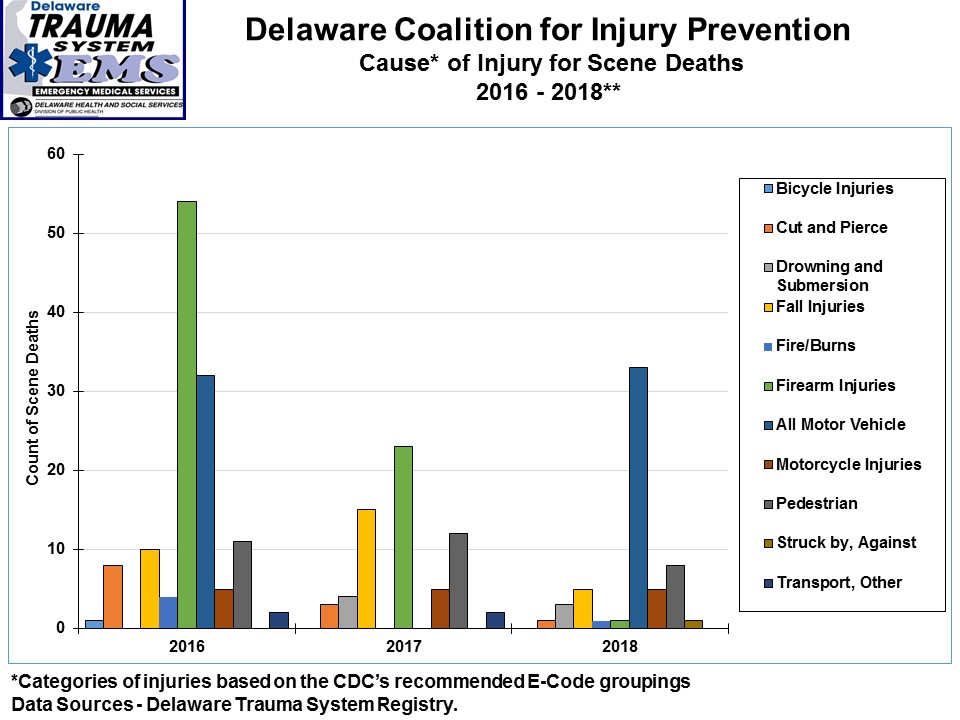
The following graph shows the cause of injury for those persons who were killed instantly in Delaware. Injury prevention measures such as seatbelts, child safety seats, and helmets, along with relevant public education, are methods of decreasing these deaths. Firearms, motor vehicles, and pedestrian incidents have caused the highest numbers of instant injury deaths in Delaware over the past 3 years.
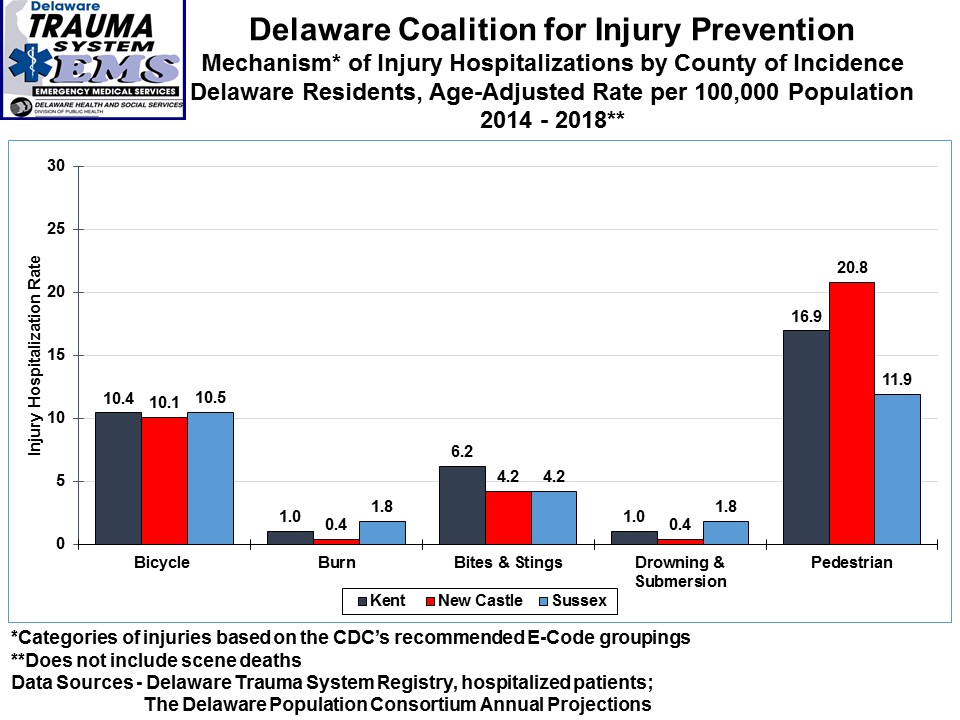
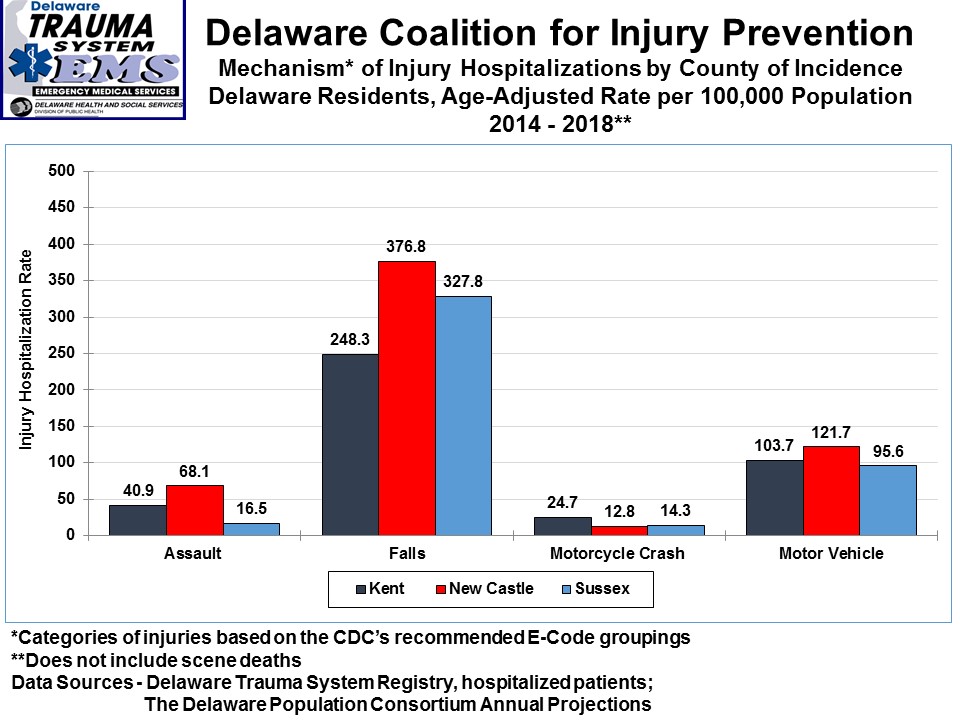
The following graphs provide information on injuries to Delaware residents, reported as age-adjusted and age-specific injury rates per 100,000 population, as discussed previously.
The first pair of graphs show the age-adjusted rate per 100,000 for Delaware residents injured seriously enough to require hospitalization by cause of injury and county of incident, from 2014 to 2018.
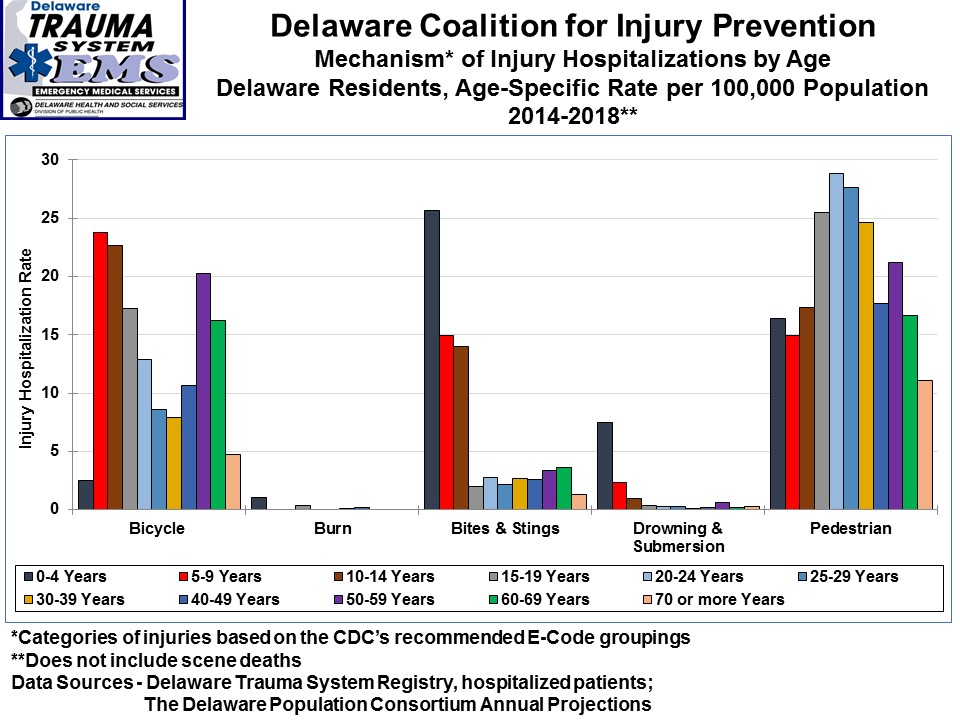
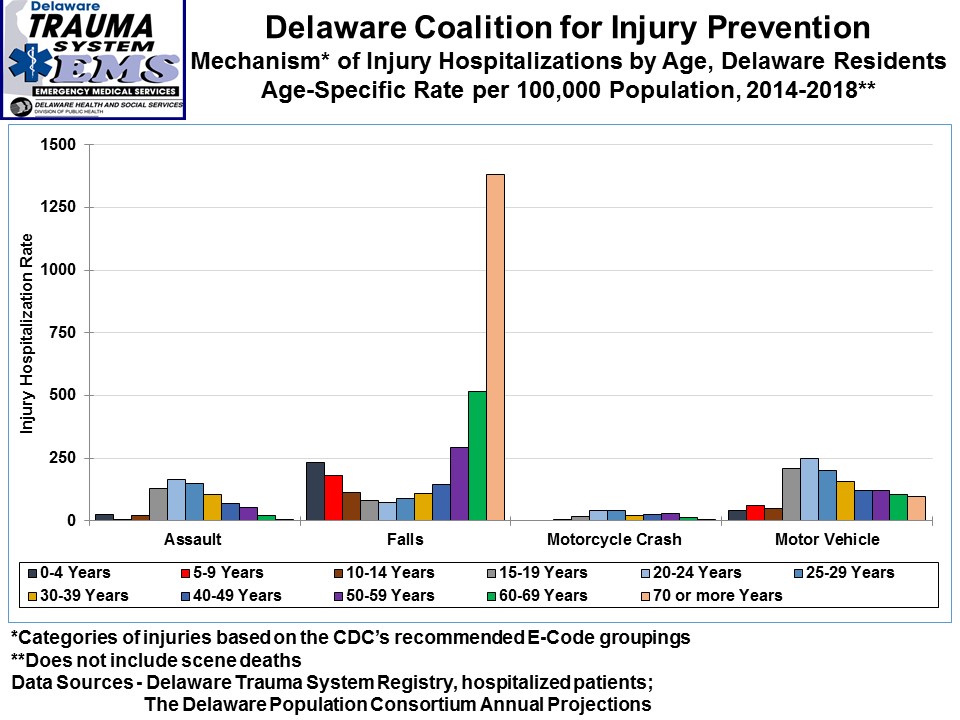
The next two graphs show the age-specific rate per 100,000 for Delaware residents injured seriously enough to require hospitalization by injury cause and age, from 2014 to 2018.
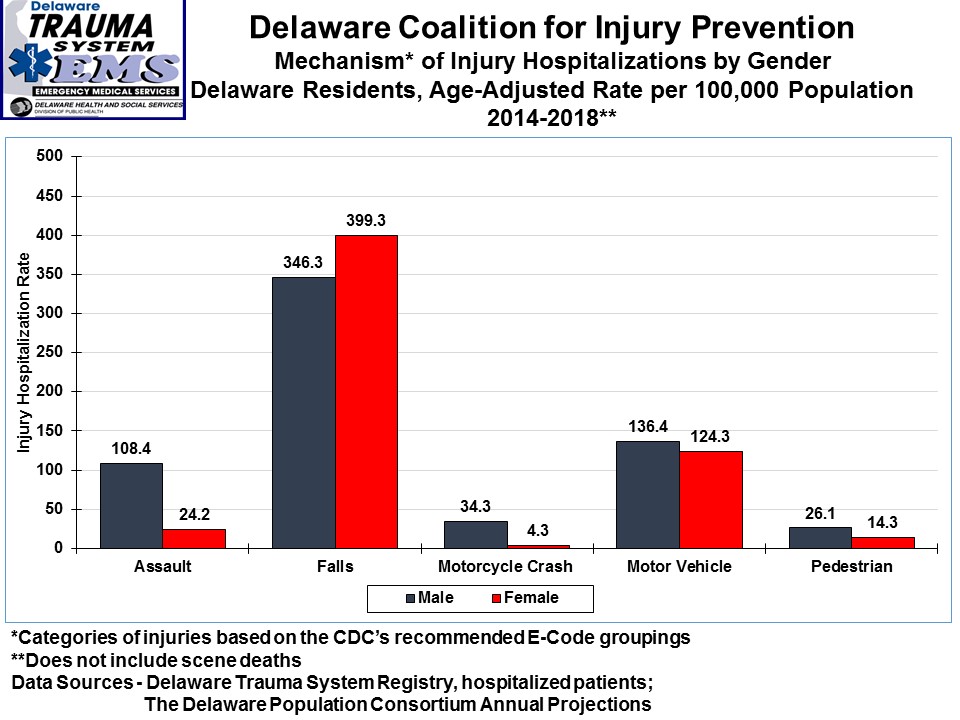
The two graphs below show the age-adjusted rate per 100,000 for Delaware residents injured seriously enough to require hospitalization by injury cause and gender, from 2014 to 2018.

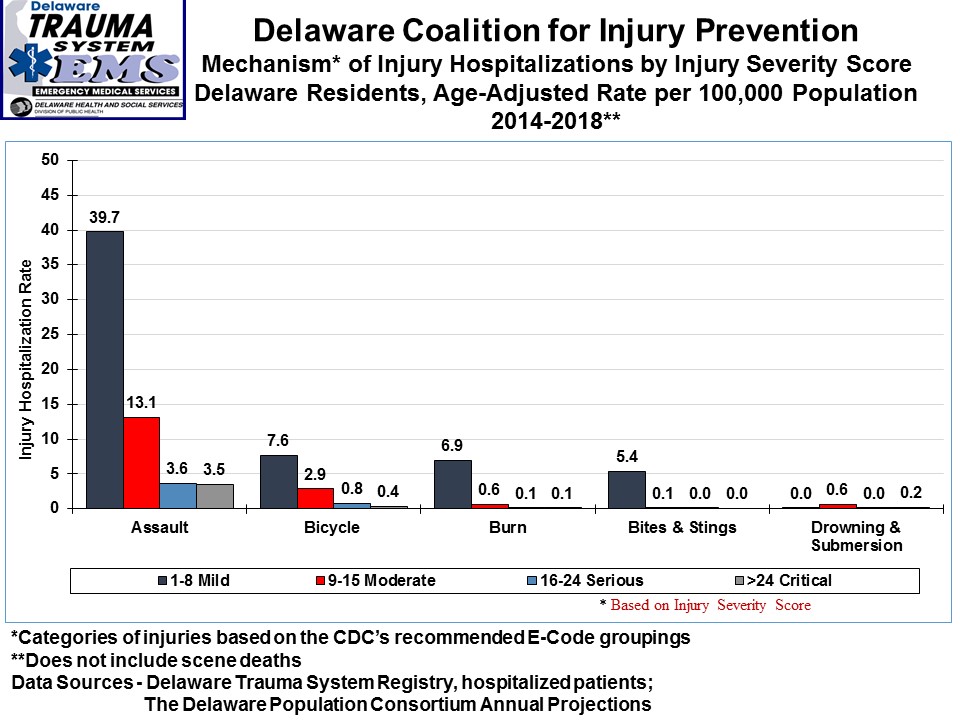
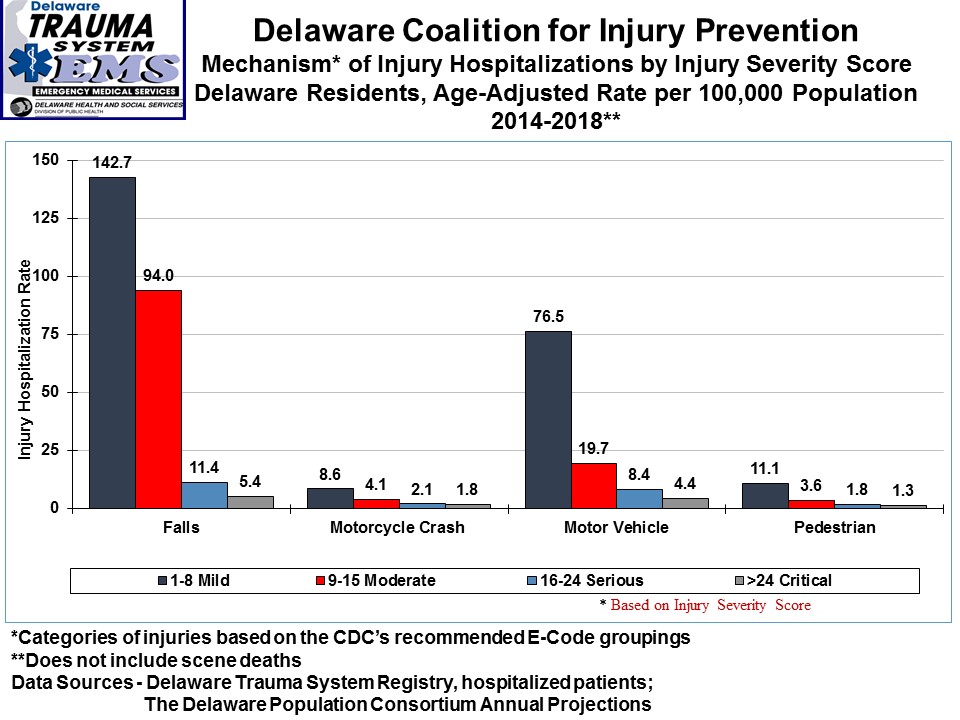
The two graphs below show the age-adjusted rate per 100,000 for Delaware residents injured seriously enough to require hospitalization by injury cause and severity of injury, from 2014 to 2018. Falls produced the largest number of critical injuries.
The Injury Severity Score referenced is a nationally accepted scoring system of injuries with a mathematical formula for determining the score of each patient. Injury severity scores are defined as 1-9 Minor/mild injury; 10-15 Moderate injury; 16-24 Serious injury; and over 24 Critical injury.
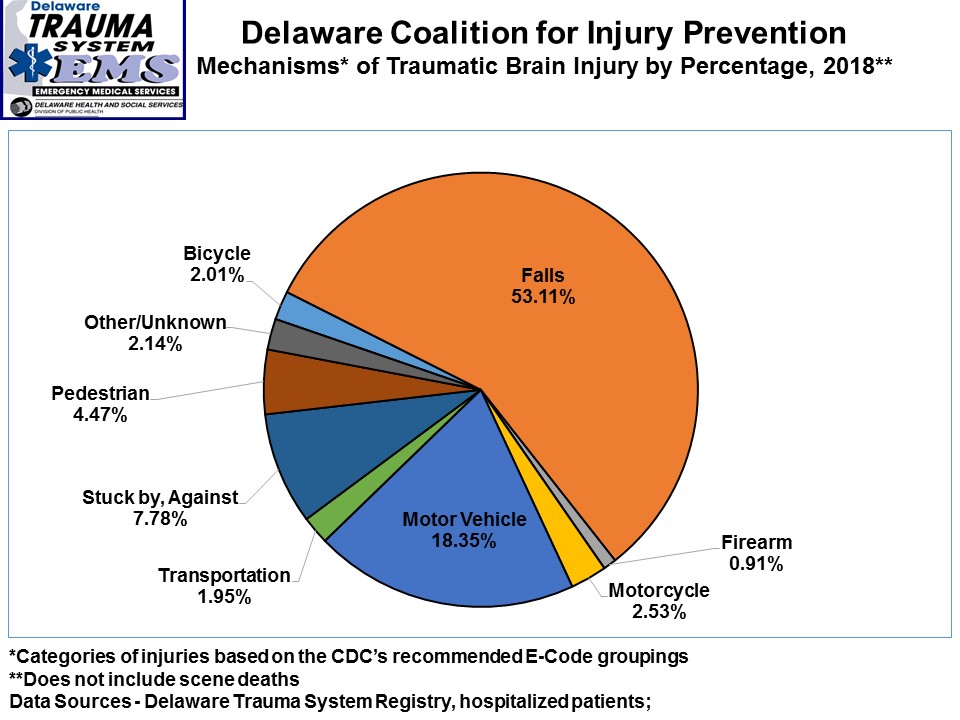
The pie chart below shows causes of Traumatic Brain Injuries serious enough to require hospitalization in a Delaware hospital in 2016 by percentage. Falls cause almost half of all Traumatic Brain Injuries.
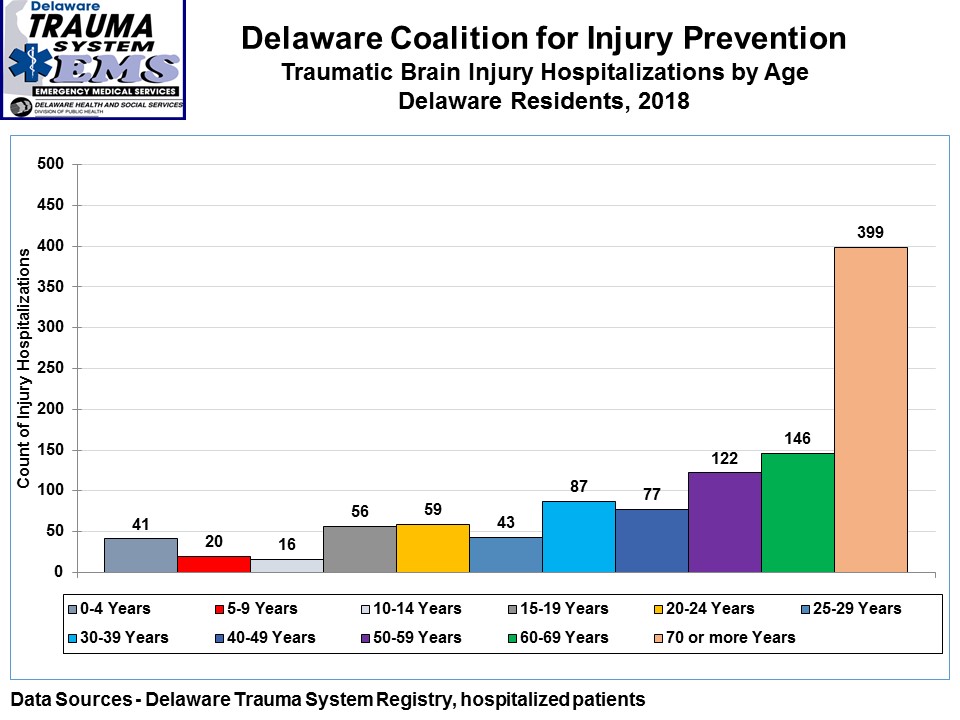
The bar graph below shows the number of Traumatic Brain Injuries requiring hospitalization by age in 2018.
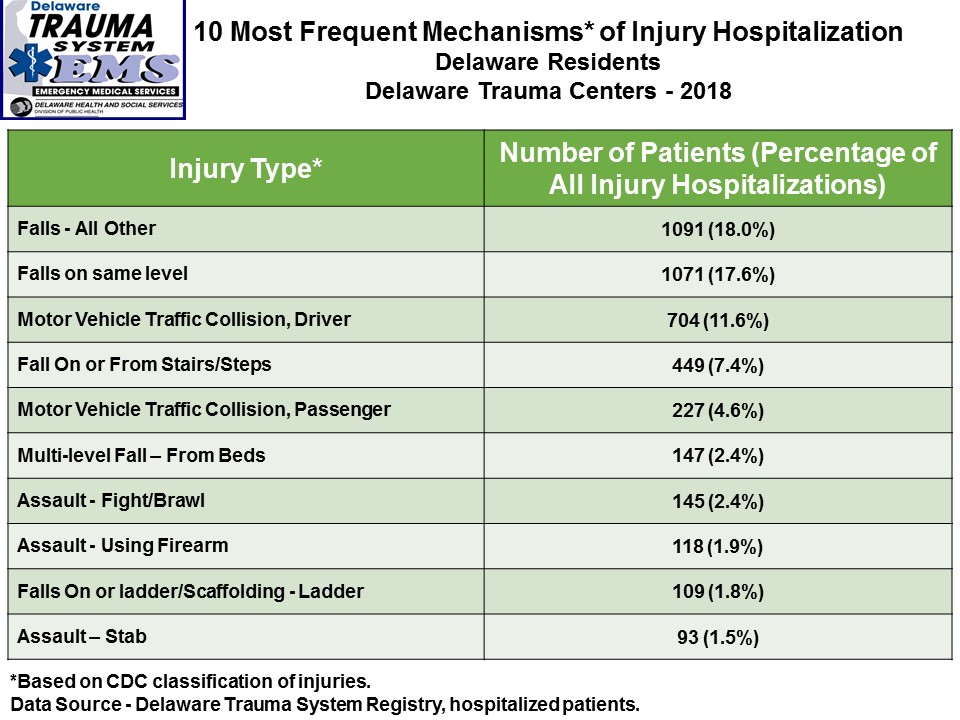
The chart below shows the 10 most frequent causes of injury hospitalizations at Delaware hospitals in 2018. Injury type utilizes the International Classification of Diseases, Tenth Revision, Clinical Modification (ICD-10 CM) External Causes of Morbidity Codes. Note that when grouped into general causes, the leading causes of hospitalizations are falls (47 percent), highway incidents (16 percent), and assaults (6 percent). These three types of injuries account for over 69 percent of Delaware injury-related hospitalizations.
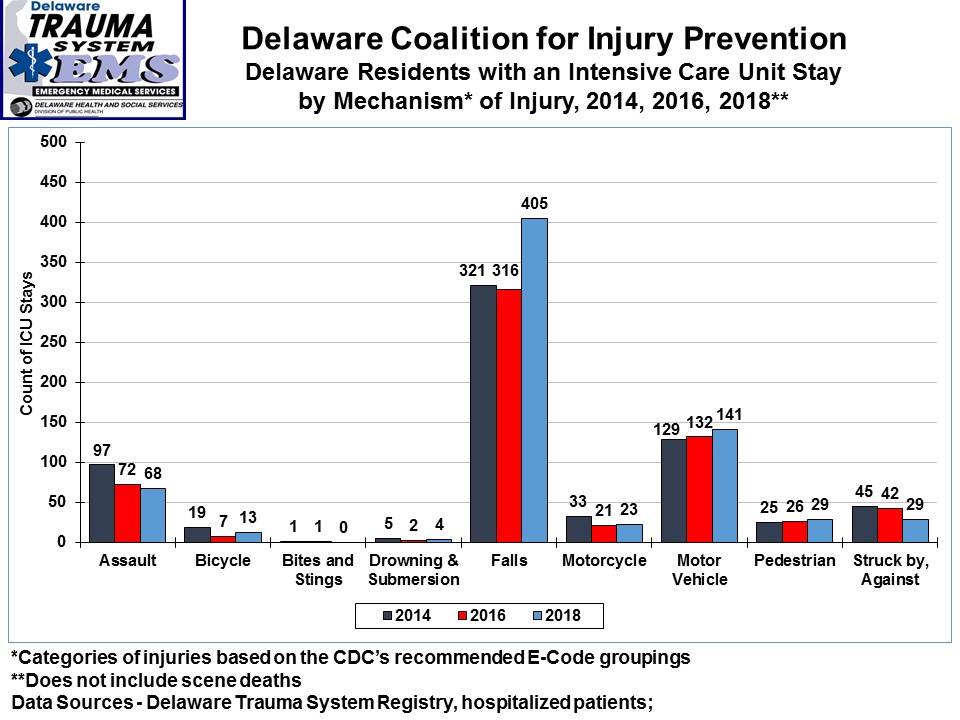
This graph illustrates the number of Delaware residents that required a stay in an Intensive Care Unit due to injury in 2014, 2016, and 2018. Notice again that falls, motor vehicle incidents, and assaults caused the most serious and critical injuries.
![]() Please note: Some of the files available on this page are in Adobe PDF format which requires Adobe Acrobat Reader. A free copy of Adobe Acrobat Reader can be downloaded directly from Adobe . If you are using an assistive technology unable to read Adobe PDF, please either view the corresponding text only version (if available) or visit Adobe's Accessibility Tools page.
Please note: Some of the files available on this page are in Adobe PDF format which requires Adobe Acrobat Reader. A free copy of Adobe Acrobat Reader can be downloaded directly from Adobe . If you are using an assistive technology unable to read Adobe PDF, please either view the corresponding text only version (if available) or visit Adobe's Accessibility Tools page.
About the Department
Secretary's Letter
Secretary Bio
Newsroom
State Jobs
Calendar
Delaware Health Care Commission
DHSS Administration Contact
Federal COVID Funding Dashboard
Delaware's Governor
State Agencies
Elected Officials
General Assembly
Delaware Courts
State Employees
Cities & Towns
Delaware State Code
State Regulations
Business First Steps
Phone Directory
Locations Directory
Public Meetings
Voting & Elections
Transparency
Delaware Marketplace
Tax Center
Personal Income Tax
Privacy Policy
Weather & Travel
Contact Us
Corporations
Franchise Tax
Gross Receipts Tax
Withholding Tax
Delaware Topics
Help Center
Mobile Apps
E-mail / Text Alerts
Social Media

Built by the Government Information Center
©MMXVIII Delaware.gov


